Compound interest means you earn interest not only on the money you put in, but also on the interest it has already earned. Each year's growth is added to the pot, and the next year's growth is calculated on the bigger pot. Over a few years the difference from simple interest is small; over a few decades it becomes most of your money.
This guide shows the formula with real numbers, then uses a table to show how much time changes the result.
Simple interest vs compound interest
With simple interest, you earn a fixed amount each year based only on the original deposit. With compound interest, each year's interest is added to the balance and earns interest itself.
Take 10,000 at 6% a year. The figures in this article work in any currency.
| Year | Simple interest balance | Compound interest balance (yearly) |
|---|---|---|
| 0 | 10,000 | 10,000 |
| 1 | 10,600 | 10,600 |
| 2 | 11,200 | 11,236 |
| 3 | 11,800 | 11,910.16 |
| 10 | 16,000 | 17,908.48 |
In year 1 the two are identical. In year 2, compound interest pays 6% on 10,600 rather than on 10,000, so you get 636 instead of 600. The extra 36 is interest on interest. It looks trivial at first, and it keeps growing.
By year 10, compounding has earned 1,908.48 more than simple interest on the same deposit and the same rate.
The compound interest formula
The standard formula is:
A = P(1 + r/n)^(nt)
- A is the amount at the end
- P is the principal, the starting amount
- r is the annual interest rate as a decimal (6% = 0.06)
- n is how many times a year interest is compounded (1 for yearly, 4 for quarterly, 12 for monthly)
- t is the number of years
The part in brackets, r/n, is the rate per period. The exponent, nt, is the total number of periods.
Worked example: 10,000 at 6% for 10 years, compounded monthly
- Rate per period: r/n = 0.06 ÷ 12 = 0.005
- Number of periods: nt = 12 × 10 = 120
- Growth factor: (1 + 0.005)^120 = 1.005^120 = 1.819397
- Final amount: A = 10,000 × 1.819397 = 18,193.97
Interest earned: 18,193.97 − 10,000 = 8,193.97.
Same example, compounded yearly
- Rate per period: 0.06 ÷ 1 = 0.06
- Number of periods: 1 × 10 = 10
- Growth factor: 1.06^10 = 1.790848
- Final amount: 10,000 × 1.790848 = 17,908.48
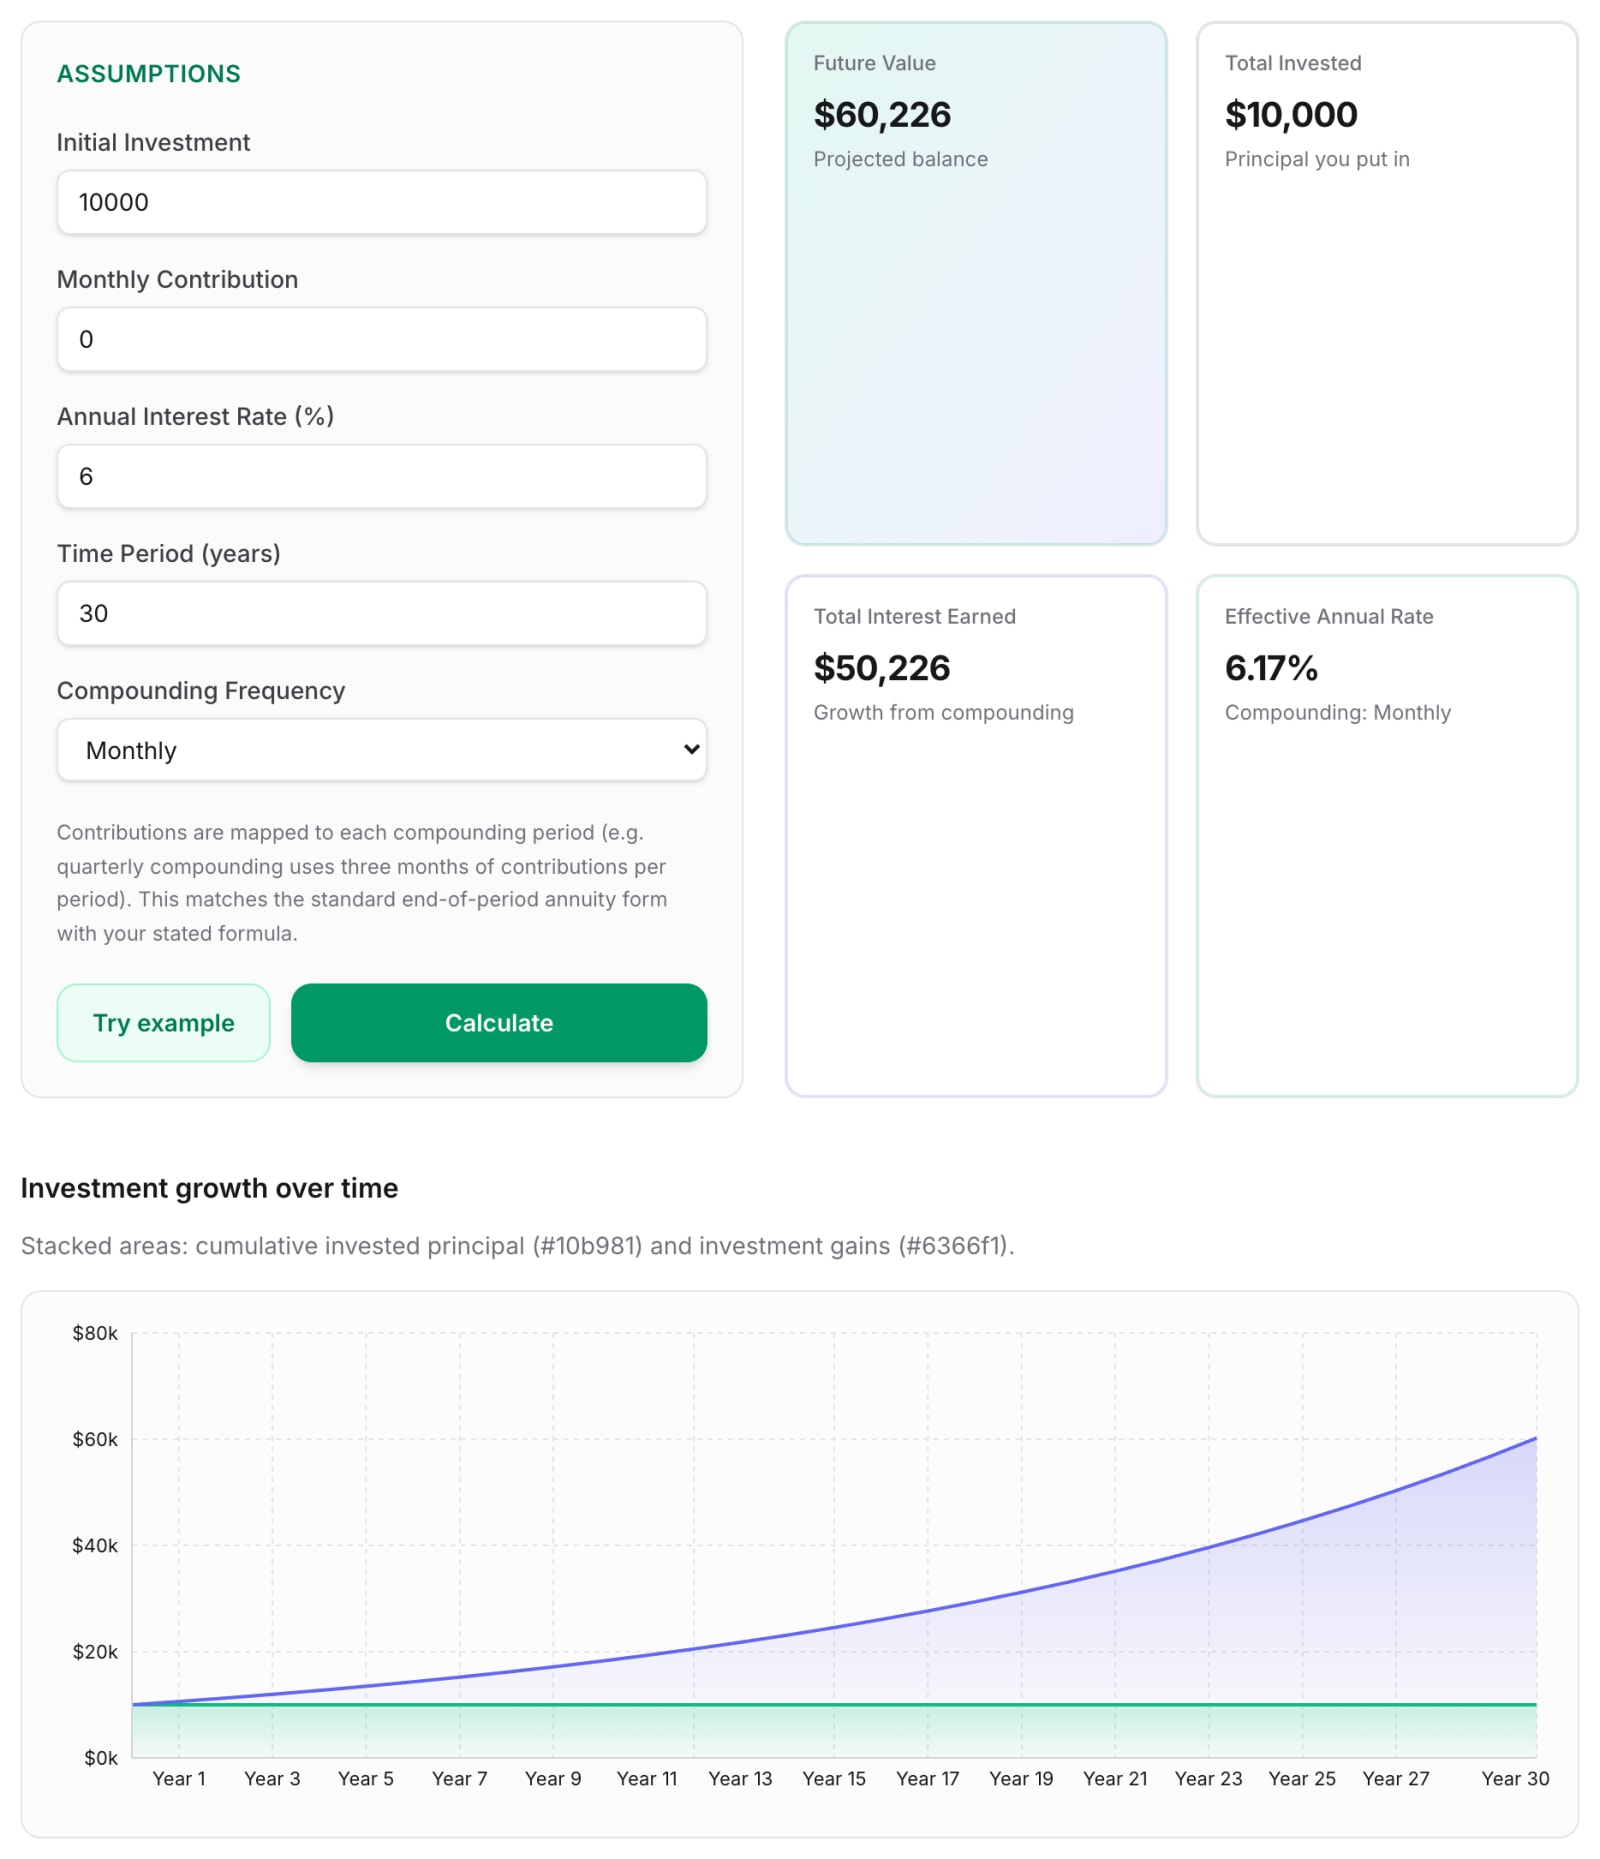
Monthly compounding adds 285.49 over 10 years here. It helps, but much less than people tend to expect. A 6% rate compounded monthly works out to an effective annual rate of 6.17%. How much compounding frequency matters in practice is covered in compounding frequency: does it matter?
How 10,000 grows over 5, 10, 20 and 30 years
Here is a single deposit of 10,000, compounded monthly, with nothing added and nothing withdrawn.
| Rate | 5 years | 10 years | 20 years | 30 years |
|---|---|---|---|---|
| Simple interest at 6% | 13,000 | 16,000 | 22,000 | 28,000 |
| 4% compound | 12,210 | 14,908 | 22,226 | 33,135 |
| 6% compound | 13,489 | 18,194 | 33,102 | 60,226 |
| 8% compound | 14,898 | 22,196 | 49,268 | 109,357 |
A few things stand out.
- At 6%, the first 10 years add about 8,200. The last 10 years add about 27,100. Same rate, same deposit, but the later years work on a much bigger balance.
- After 30 years, 6% simple interest gives 28,000; 6% compound gives 60,226. More than four-fifths of the compound balance (50,226 of it) is interest, and most of that is interest on interest.
- At 8%, the balance roughly doubles every 9 years. That's a handy pattern called the rule of 72.
With yearly compounding, the interest in year 1 on this deposit is 600. In year 30, it's 3,251.03, from the same original 10,000 and the same 6%.
Why time matters more than rate for most savers
People spend a lot of effort hunting for a slightly higher rate. For most savers, the number of years the money stays invested matters more.
A lower rate for longer beats a higher rate for less time
From the table above:
- 10,000 at 6% for 30 years grows to 60,226
- 10,000 at 8% for 20 years grows to 49,268
The extra decade at the lower rate is worth more than two extra percentage points.
Starting early with less beats starting late with more
Now compare two savers who each put in 200 a month at 6%, compounded monthly, and who both stop looking at the balance at the same point, 30 years from now.
- Saver A invests 200 a month for the first 10 years, then stops contributing and leaves the money alone for 20 more years. Total put in: 24,000.
- Saver B waits 10 years, then invests 200 a month for 20 years. Total put in: 48,000.
| Saver A | Saver B | |
|---|---|---|
| Years contributing | 1–10 | 11–30 |
| Total contributed | 24,000 | 48,000 |
| Balance at year 10 | 32,776 | 0 |
| Balance at year 30 | 108,495 | 92,408 |
Saver A put in half as much and ends up with 16,087 more. The first 10 years of contributions had 20 extra years to compound.
Regular contributions over different time spans
If you invest 200 a month with no starting lump sum:
| Rate | 10 years | 20 years | 30 years |
|---|---|---|---|
| Total contributed | 24,000 | 48,000 | 72,000 |
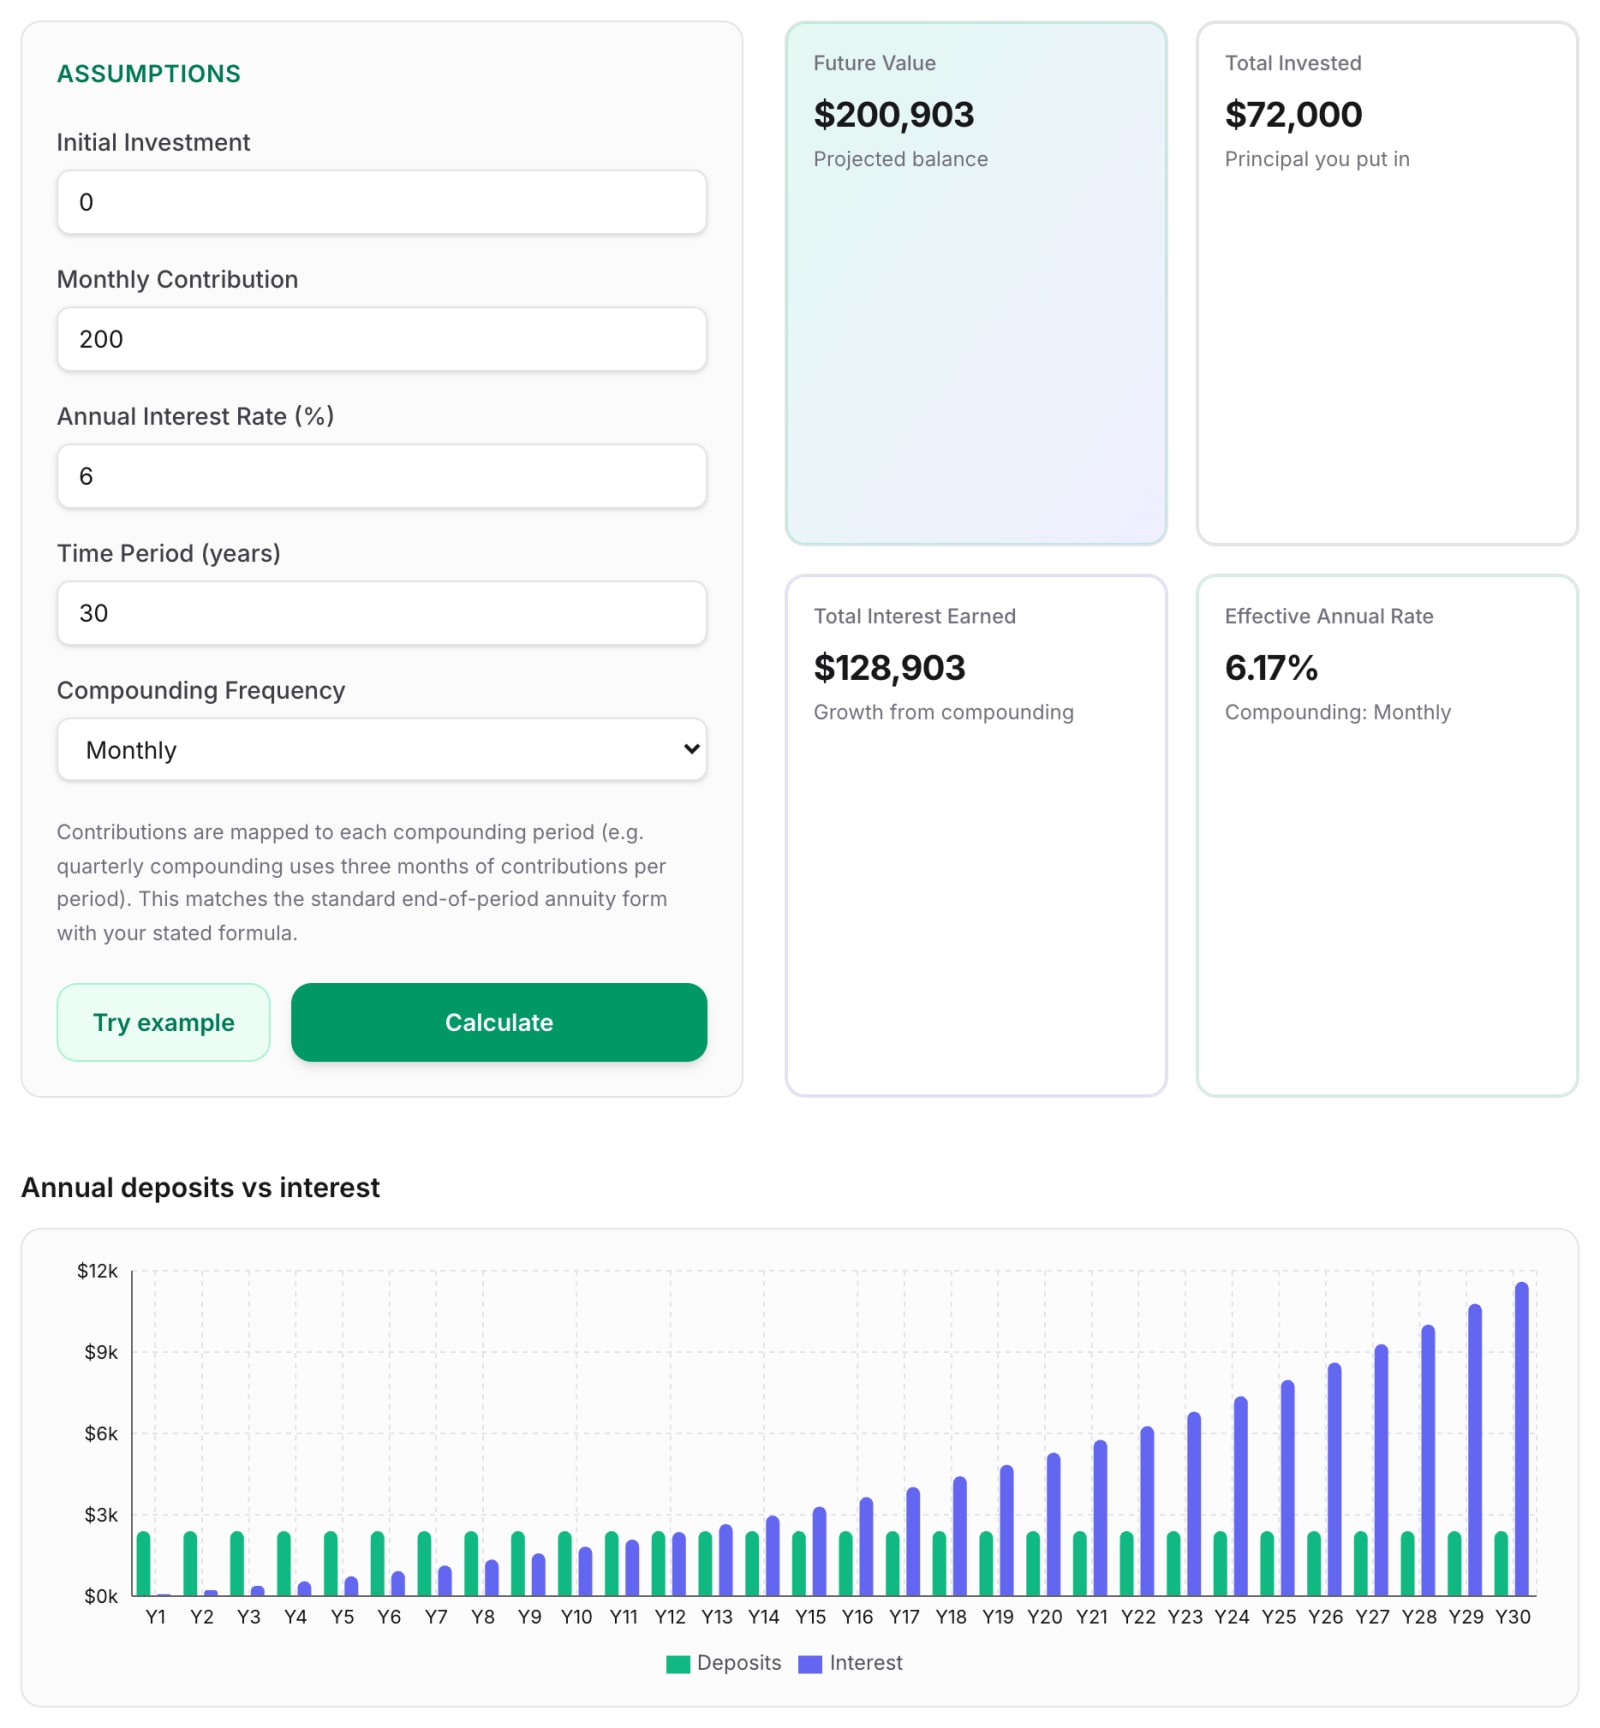
| 6% | 32,776 | 92,408 | 200,903 |
| 8% | 36,589 | 117,804 | 298,072 |
At 6%, going from 20 to 30 years adds 24,000 of contributions but more than doubles the final balance. The trade-offs between investing monthly and investing a lump sum are covered in monthly investing vs lump sum.
None of this means rate is irrelevant. Over 30 years, 8% gives about 97,000 more than 6% in the table above. But you control your start date and how long you stay invested far more reliably than you control your return.
Where compound interest works against you
The same maths applies to debt. A credit card balance or a loan where unpaid interest is added to what you owe grows the same way, and at higher rates than most savings earn. If a debt charges more than your savings earn, paying it down is usually the better use of spare cash. On amortizing loans, interest is charged on the falling balance each month, which is a different pattern; see how to read an amortization schedule.
Limits of these examples
The tables above are useful for understanding, but real life is messier.
- Returns aren't fixed. Savings accounts may have a fixed rate for a period. Investments such as shares go up and down, and a long-run average says nothing about any single year. A projection at a steady 6% or 8% is an illustration, not a forecast.
- Inflation reduces what the final number buys. 60,226 in 30 years won't buy what 60,226 buys now. See inflation and real returns.
- Fees and taxes come off the top. An annual fee of even 1% reduces the rate that compounds, and over decades that adds up. Tax rules on interest and investment gains vary by country and account type, so check what applies to you.
- Rates change. Any figure you see advertised now may be different next year. Use your own realistic assumption rather than the best rate you've heard of.
Next step: try your own numbers
Open the Compound Interest Calculator and enter your Initial Investment, Monthly Contribution, Annual Interest Rate, Time Period in years, and Compounding Frequency (monthly, quarterly or annually). It shows the Future Value, Total Invested, Total Interest Earned and the Effective Annual Rate, along with a growth chart, an annual deposits-vs-interest chart and a year-by-year breakdown table. A good first experiment: keep everything fixed and change only the Time Period, then change only the rate, and see which moves the result more.
For a quick way to estimate growth in your head, read the rule of 72 explained.
This article is general information, not financial advice.